
Modern agents are distributed reasoning systems that orchestrate model calls, tools, memory and external APIs in unpredictable ways. When an agent loops, uses the wrong tool or drifts off-plan, the root cause most of the time is hidden behind thousands of lines of nested JSON logs. At Quotient AI we believe that reliable AI agents are built on visibility.
To solve this gap, the team behind Evil Martians introduced AgentPrism, an open source visualisation engine built on OpenTelemetry that translates raw agent traces into structured, explorable execution graphs. We have integrated that into the Quotient AI dashboard capability that surfaces the complete execution trace of your agents.
With this release, engineers and observability teams can inspect exactly what happened: every plan, call, tool execution, retry, and cost impact, visualised in one place.
Why agent tracing is a harder problem than backend tracing
Backend traces usually follow a DAG-shaped request path. Agents violate that assumption, it can:
- Run nested reasoning loops
- Trigger multiple tool calls in parallel
- Create partial plans and re-plan based on intermediate output
- Repeat or regenerate tool arguments
- Fail probabilistically
- Produce structurally inconsistent traces
These patterns break assumptions of traditional observability stacks. Developer logs collapse into multi-level JSON where temporal ordering, hierarchy and cost attribution are almost impossible to infer.
This is exactly where Quotient’s AgentPrism integration shines.
Features like Tree View for structure, Timeline for temporal and cost clarity and detection badges inline on spans directly address these nonlinear behaviors, turning unstructured agent activity into a coherent, navigable execution model.
How the AgentPrism model works under the hood
Span schema design: capturing meaningful agent semantics
At its core, AgentPrism layers a structured trace model on top of OpenTelemetry. Every reasoning step, tool invocation or model call becomes a span enriched with context:
- the operation being performed (e.g., model_call, plan_step, tool_call)
- the inputs (prompt text, arguments, metadata) and outputs (LLM output, tool result, structured plan) involved
- error states (status codes, model, or tool-level errors)
- timestamps, token usage and cost
- the parent-child relationships that define the flow of execution
This transforms raw activity into semantically rich, context-aware units instead of flattened log blobs.
Execution reconstruction pipeline
Once spans are collected, it first normalises the incoming events from the agent runtime, resolves parent-child links, then builds a hierarchical tree that mirrors how the agent actually reasoned. From timestamps, it infers ordering and concurrency, making chains, branches and parallel tool calls easy to distinguish.
AgentPrism also applies structural optimisations like collapsing repeated spans and detecting loops, giving a clearer picture of behaviour without hiding any underlying detail. This provides an execution model that can power multiple views without re-parsing payloads each time.
What ships today in Quotient
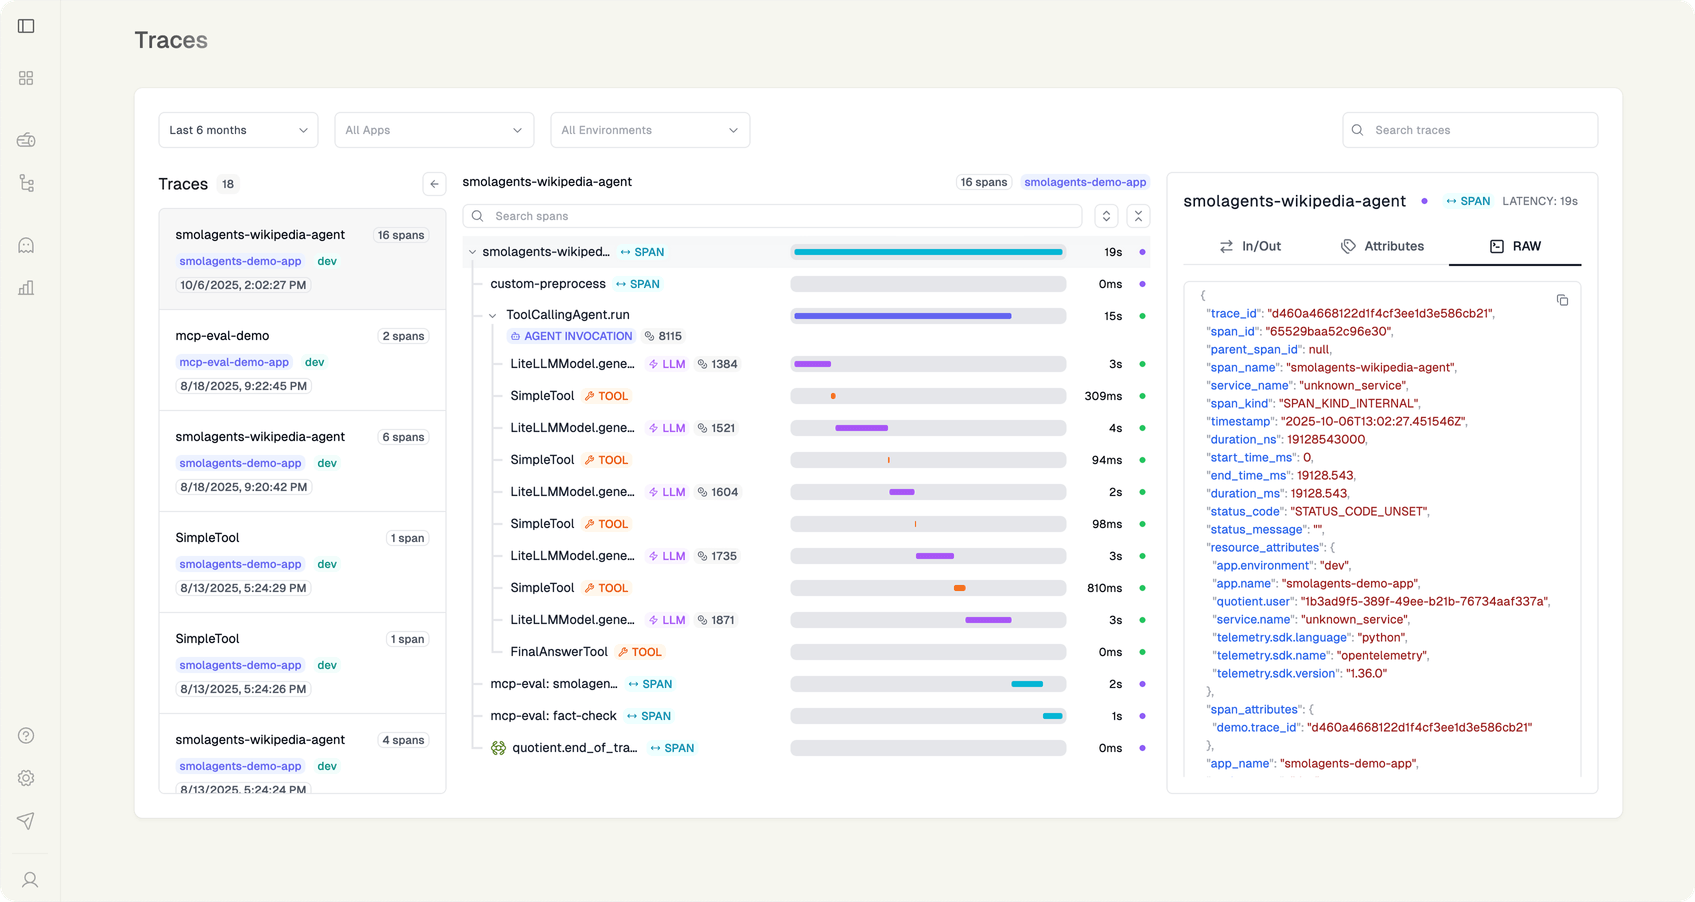
The new Trace Visualizer is live for every workspace that streams traces or detections to Quotient Reports:
- Drop-in ingestion: If you already emit OpenTelemetry spans (via LangChain, LlamaIndex, or raw SDK), nothing changes. Quotient’s pipeline converts them with the
openTelemetrySpanAdapter(AgentPrism) and stores a normalized span tree. - Trace Explorer panel: From any report cluster or log search result, click “View trace” to open AgentPrism inside Quotient Dashboard. Tree + Timeline stay in sync, so selecting a problematic span scrubs both panes immediately.
- Detection overlays: Reliability detections (hallucination, citation coverage, doc relevancy, policy breaches) appear as badges inline with each span. Hovering reveals the raw detector output so you can see why a step failed without jumping to another dashboard.
- Cost + latency budgets: Timeline cells show
gen_ai.usage.costand latency pulled straight from span attributes, letting ops teams catch runaway loops or misconfigured models in seconds.
Quick Example Scenerio
Consider a retrieval-augmented workflow where the LLM occasionally loops when the retriever returns low-quality results.
Without tracing: You see repeated API calls, vague logs and inconsistent behaviour.
With the AgentPrism trace on Quotient:
- Tree view shows a repeated “plan_step → retrieval → model_call” chain
- Sequence diagram reveals the LLM keeps concluding “not enough info, try again”
- Timeline highlights a cost spike caused by ten consecutive retrieval attempts
- Deep span inspection shows a malformed argument generated in the second span
- Developer identifies the missing guardrail and patches the planner
A multi-hour debugging session becomes a few minutes.
Getting access
To experiment locally:
- Update the Quotient SDK (
pip install quotientai>=0.7.0ornpm install @quotientai/sdk@latest). - Ensure
logger.init()includessample_rate=1.0for the traffic you want to visualize and forwards OTLP attributes likegen_ai.*andopeninference.*. - Push a few runs, then open Telemetry → Traces and select any span to launch the AgentPrism viewer.
What’s next
AgentPrism is now the canvas for every reliability insight we surface. From here we can:
- Auto-pin spans that correlate with report clusters, so you can jump from “Regulatory filings are unreliable” to the exact tool invocation causing it.
- Overlay per-span policy evaluations and playbooks, shrinking the gap between detection and remediation.
- Let teams embed visual traces into postmortems, RFCs, or Notion docs without exporting PNGs.
Tomorrow’s launch is about celebrating the open-source work that made this possible and giving Quotient users a production-ready way to see their agents think. Log into app.quotient, open any trace, and experience the new AgentPrism view for yourself.
Get started now
If you’re a Quotient AI user, you’ll find the new trace-visualiser option under Dashboard → Agent Traces. If you want this enabled on your organisation’s workspace or want guidance on instrumentation, reach out and we’ll help you wire it up.
Let’s make agent reliability measurable, visual and controllable.